

- World-Wide-Web Codes:

- Web Application Development/Tools:
- CSS Introduction
- So what is CSS,Really?
- The Big Picture
- New Features in CSS3
- CSS Quiz Exercise
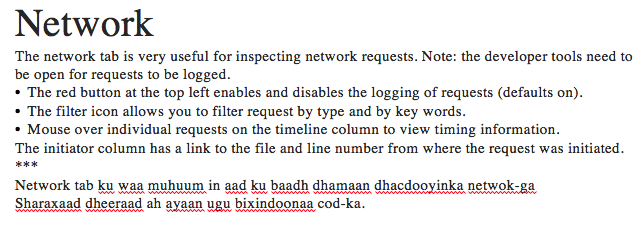
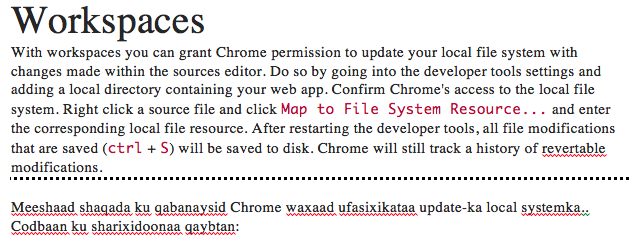
- Discover How to Benefit Devtools

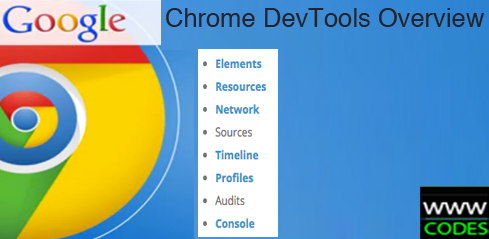
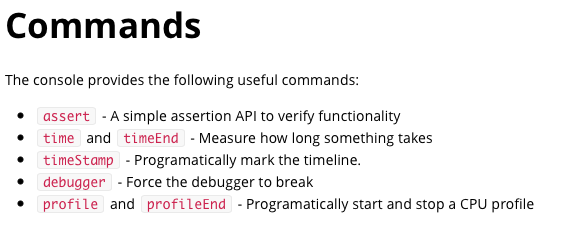
Chrome Developer Tools
Devtools Introduction
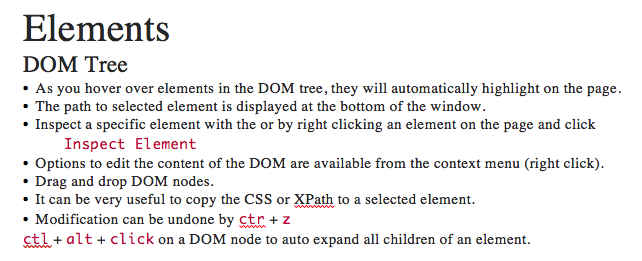
Discover How to Benefit Devtools [8]
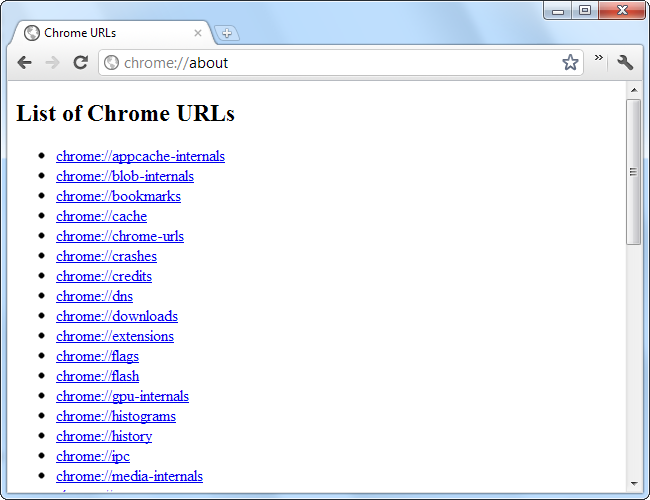
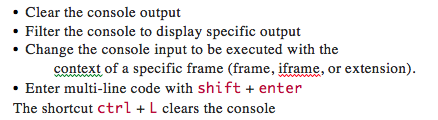
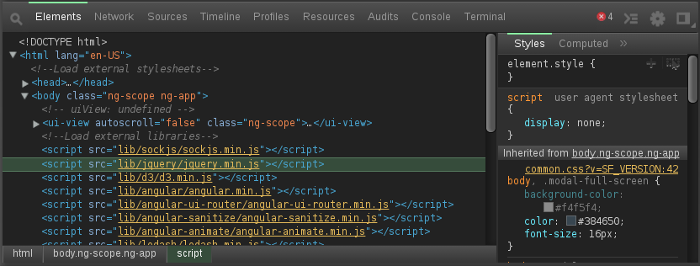
The chrome://about page lists all Chrome's internal pages. Click any of the links to access the page. Many of them are the same pages you can access from Chrome's menus for example, chrome://bookmarks is the bookmarks manager and chrome://settings is Chrome's options page.
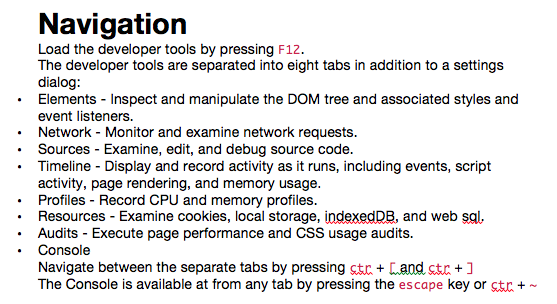

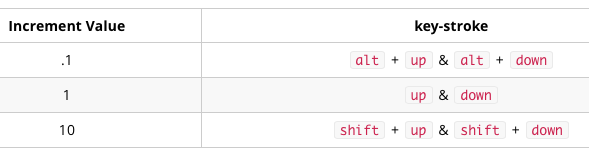
Increment property values with the following shortcuts:
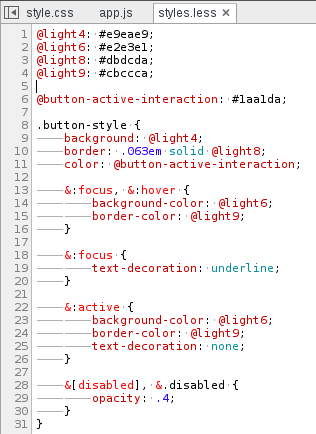
LESS and SASS Source Maps
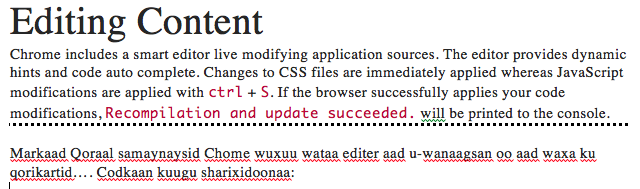
Chrome supports mapping the transpiled CSS rules back to the original SASS or LESS source. Make sure CSS source maps are enabled within the settings dialog.
![]()
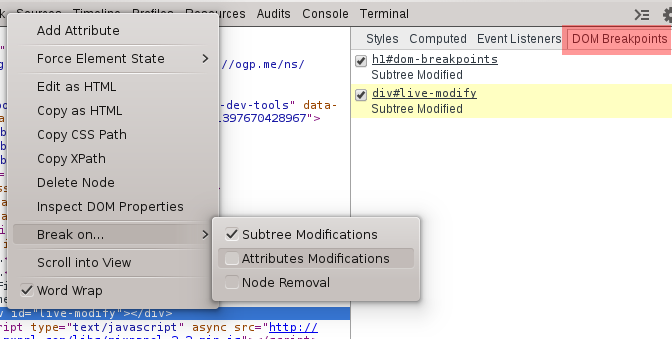
DOM Breakpoints
DOM Breakpoints are useful to break on DOM mutation events, such as when a node is removed, modified, or its attributes are changed. You can view all current DOM breakpoints on the DOM Breakpoint tab.
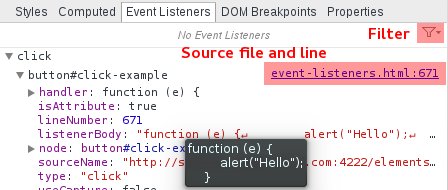
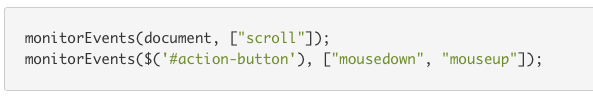
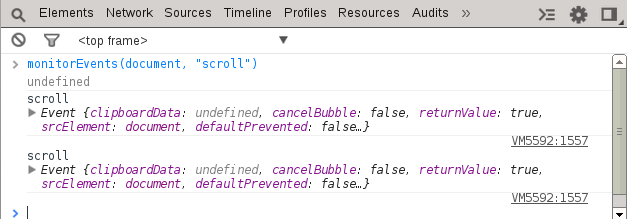
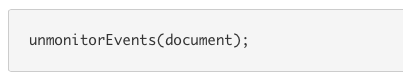
Event Listeners
Inspect event listeners associated with individual DOM nodes. Use the filter icon to restrict the event listeners to only the selected node.
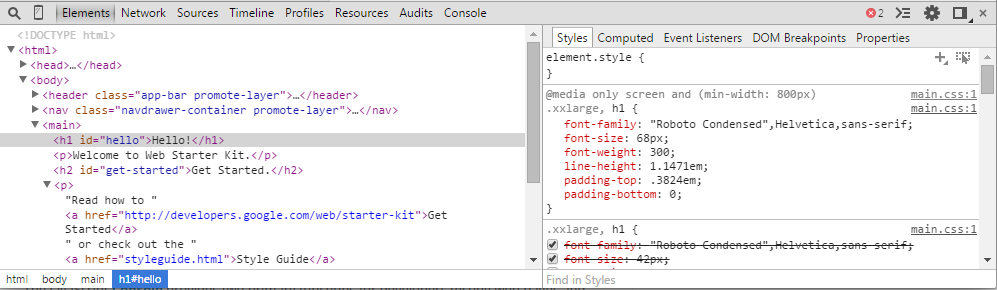
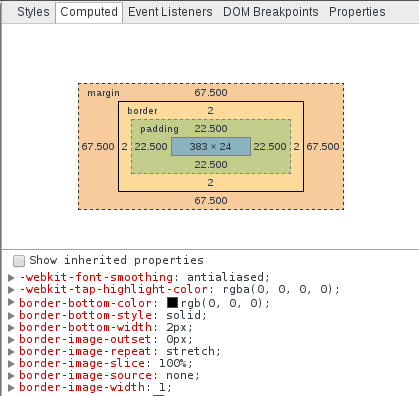
Computed Properties
Sometimes CSS properties are dynamically computed based upon the context of the style. For example an property value with an em unit is proportional to the parent element.
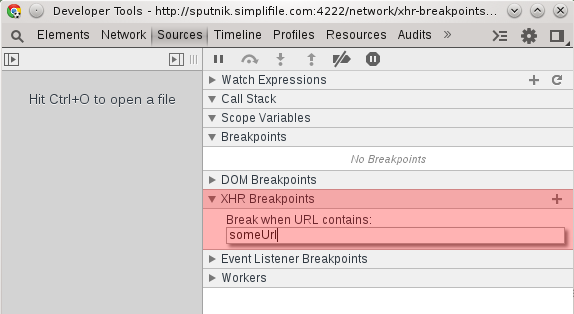
XHR Breakpoints
XHR Breapoints allow you to break whenever a server request URL contains a particular value. Add an XHR breakpoint within the Sources tab. Click the + icon and enter a value to break on.
Sources
One of the developer tools most powerful features is the sources tab. This section is essentially an integrated development environment which allows you to build, test, and debug web apps.
Navigate within the sources tab with the following shortcuts
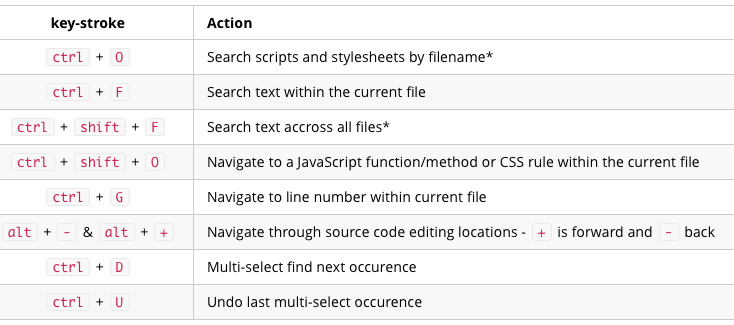
* Available in all tabs (network, sources, elements, etc)
Pretty Print
Auto format minified JavaScript and CSS source with pretty print.
Debugging
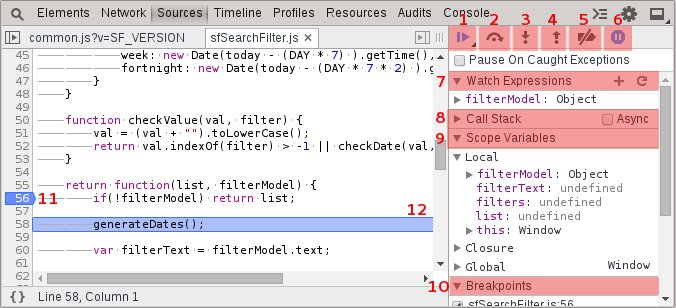
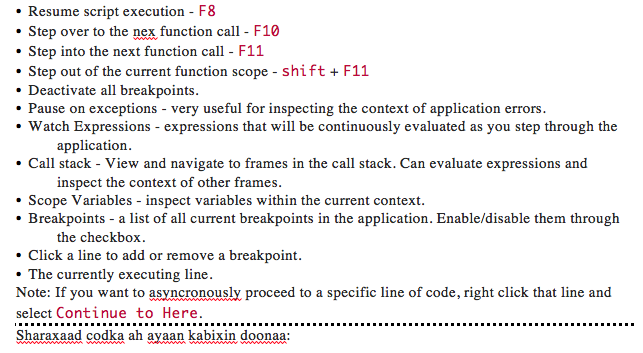
Long Resume
Resume with all pauses blocked for 500ms by long pressing on the resume button and selecting the second resume button in the menu. Useful to skip over many breakpoints.
In this demonstration we hit the first breakpoint twice. When we resume the second time we do not hit the second breakpoint.
Uncaught Exceptions
Sometimes you may have a console error but have no idea where or how the exception was thrown. You can have the dev tools immediate break at uncaught or caught exceptions by clicking the (stop) icon. Use in conjunction with pretty-print in minfied apps.
Asynchronous Stack Traces
Asynchronous stack traces allow you to inspect function calls beyond the current event loop. This is particularly useful because you can examine the scope of previously executed frames that are no longer on the event loop. This feature is currently an experiment and needs to be enabled.
In the example above, notice the difference when asyncronous stack traces are enabled and disabled. Also note that the feature needs to be enabled before the breakpoint is reached.
Note: A beta version of Chrome may be necessary for this feature.
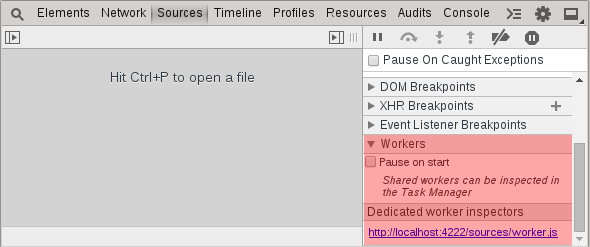
Web Workers
HTML5 provides an API for spawning background scripts that can run concurrently with the primary JavaScript execution thread. Chrome developer tools provide a convenient way for debugging these background workers (threads). Each separate worker has its own dedicated inspector listed as a link. Clicking on one of the worker inspectors will boot a new instance of the chrome dev tools specific for that background thread. Optionally you can also have workers break automatically when they first boot.
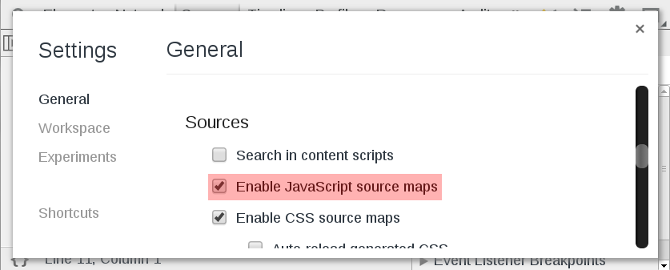
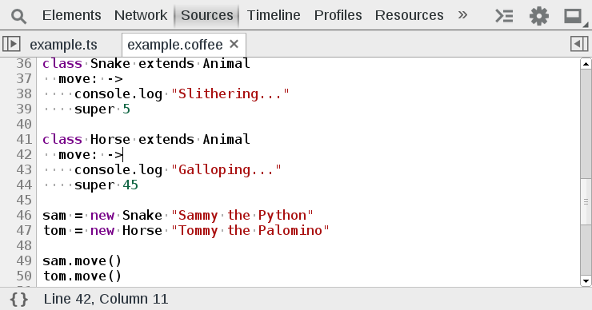
Source Maps
The Chrome dev tools support source maps, which allow you to debug transpiled JavaScript code as their original source language. This may include TypeScript, CoffeeScript, ClojureScript, or ECMAScript 6. Sourcemaps are especially useful because you can place breakpoints, step through, and debug the originally authored source. Make sure that you enable JavaScript source maps by checking the option within the settings:
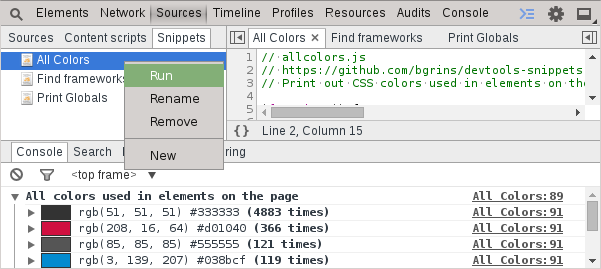
Snippets
Chrome provides a "snippets" bucket within the developer tools which allows you to manage small (or large) scripts that can be injected onto a page. Scripts can do things like inject jQuery into a page, log all globally defined variables, or print out all colors from computed styles used in elements on the page.
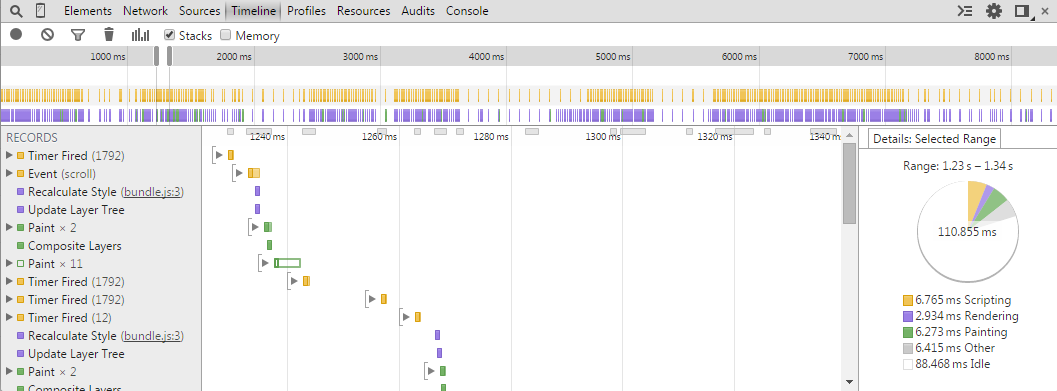
Timeline
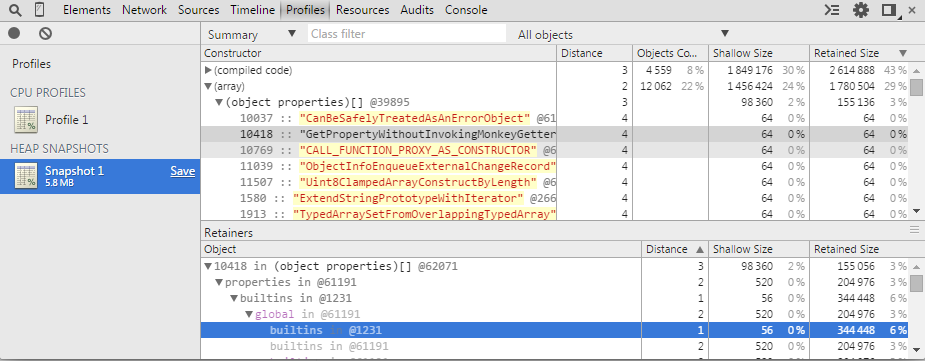
Profiles
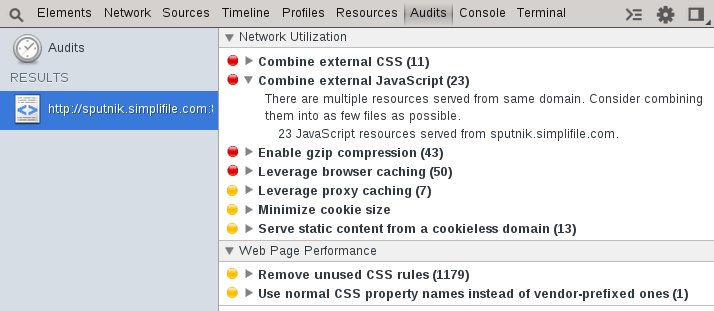
Audits
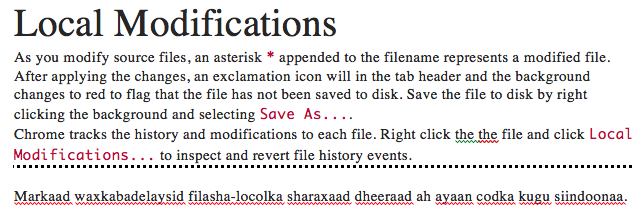
This tab allows you to run network utilization and performance audits on your web app. The audit results are automatically sorted based upon severity, red being the most severe and yellow the least.

![]()

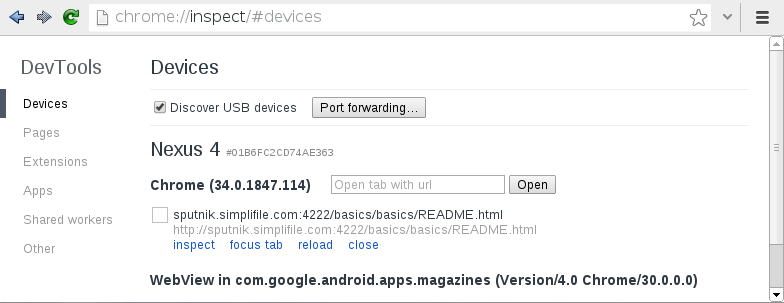
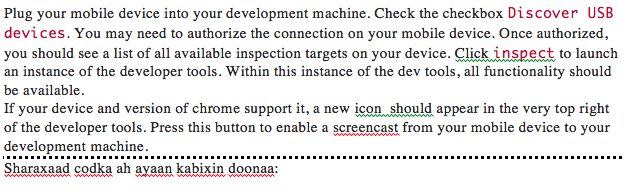
USB Debugging
Remotely debugging allows you the full chrome developer tools enabled within the environment of your remote device. You can remotely debug mobile devices by navigating to chrome://inspect.
 Printer Friendly Version